
Always Keep Key Performance Indicators (KPI) in Focus
Every marketing campaign should have clearly defined key performance indicators (KPI) that are completely within the control of that marketing campaign. For instance, a KPI could be registrations for events, requests for more information, RFPs, or sales from an online store. Those KPI’s should then be assigned target numbers that serve as a benchmark to gauge performance. Any changes or analysis of marketing campaigns should ultimately be viewed through the lens of those KPI’s to determine if they are beneficial or detrimental adjustments.
Trainers, consultants, and professional coaches can get caught up in the details of their marketing efforts and lose sight of the end goal. This commonly happens because the details are so apparent and the ease of accessing and comparing them appears to be a ready-made way of gauging success. But if results are viewed without the lens of KPI’s, some very questionable decisions might be made.
Look at the graph below. Without any context on what the numbers mean which email is the best?
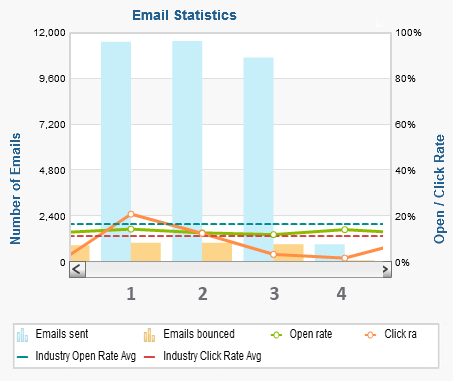
#1 sure looks like the clear cut winner with the highest open and click rates. #4 looks like the loser with an average open rate and a terrible click rate. Furthermore, using the industry average gauge makes it appear as if the entire campaign is slightly underperforming.
But when viewed through the KPI lens the data tells a very different story. The KPI for this campaign is people registering for events or training programs. Email #1 is an article email with a report download. While it’s a good sign that the audience is engaged, that particular email had no direct effect on the KPI. It is a support email to keep audience engagement to support KPI driven emails.
The true KPI driver is email #3 which was an invitation to an event that garnered progress toward KPI goals and direct revenue. Even though the click rate is much lower most of the people clicking will go on to register for an event or program. What about email #4 that looks so bad? Did you notice the emails sent are far fewer? This is a reminder email for registrants to a particular training session. While the performance looks poor there was almost no clickable links in the email, but again it was a critical support to KPI’s.
What about the entire campaign looking substandard? This training firm offers live customized events where most of their competitors have short on-demand online training. The industry standard is higher because the barrier to entry is typically much lower. This training firm is actually doing a great job with their open and click rates given the depth of their offering and the need for relationship development that the rest of the industry does not experience.
In this small subset exercise this seems obvious but your data can be much less clear when an entire ongoing digital marketing campaign is analyzed. This exact data but in a larger chart led to a question, “Why don’t we do email #1 all the time and stop wasting time on poor performers?”
The answer is because then the campaign would not support the KPI’s that were set. As you make adjustments to improve performance, make sure thatr those adjustments support your end goal, the KPIs.